New analysis from scientists at the Natural History Museum reveals that current conservation efforts are not adequately protecting the most critical ecosystem services on which six billion people depend.
In 2022, parties to the United Nations Convention on Biological Diversity signed the Kunming-Montreal Global Biodiversity Frameworkopens in a new window. This is a landmark deal which, amongst other ambitions, seeks to conserve 30% of land and waters by 2030. This target is nicknamed ‘30 by 30’.
So far, the approach to implementing 30 by 30 has been to strengthen and expand the global network of protected and conserved areas. However, our analysis shows that this might not be enough to make 30 by 30 work for people and planet.
What we found
Our analysis, using the Biodiversity Intactness Index (BII) developed by the Natural History Museum, shows that the current approach to implementing 30 by 30 on land is not adequately protecting areas delivering the most critical ecosystem services for people.
Ecosystem services are provisions from nature that directly and indirectly affect human wellbeing. They include provisions such as food, energy and raw materials, regulation of water quality and carbon storage.
Over six billion people rely on the top 30% of land that delivers the most critical ecosystem services. Currently, only 22% of the land delivering these services is located within the global protected area network. Within this 22%, biodiversity intactness is declining more quickly than it is outside protected areas. This means that current conservation efforts are not working to sustain these critical ecosystem services, and we risk losing them.
Our analysis also shows that of the important locations that are not currently situated within protected areas, biodiversity intactness has already been degraded to just 55.41%.
These findings highlight the urgency of ensuring that conservation strategies are mindful of areas delivering the most critical ecosystem services. We also need to ensure that effective management plans are in place to safeguard the protection of these areas for the future.
Key statistics
Biodiversity intactness globally declined by 1.88% between 2000 and 2020, from 61.26% to 59.37%.
Biodiversity within areas that deliver the most critical ecosystem services is declining at a faster rate of 1.91%. These areas are also more degraded, with a biological intactness of 55.41% in 2020.
Biodiversity intactness was higher in protected areas in 2020 at 71.60% but declined faster by 2.01% between 2000 and 2020.
Biodiversity intactness in protected areas that deliver the most critical ecosystem services is declining fastest by 2.12% between 2000 and 2020, despite having the highest biodiversity intactness of 73.23% in 2020.
Only 22% of land delivering the most critical ecosystem services is currently located within protected areas.
What we are calling for
We need to move beyond the current approach to designating protected areas and place more emphasis on the quality of those areas, their effective management and the value they return for people and nature.
To achieve this, the implementation of 30 by 30 should be driven by the following principles:
Alongside species protection, we need to place more attention on effectively conserving the land that delivers the most critical ecosystem services for people.
We need to move beyond the static designation of areas that merely meet minimum requirements or focus on specific species or outcomes. Instead, we should move towards a more dynamic and closely monitored process whereby areas can be ‘managed up’ to a state of greater resilience.
Strengthening capacity at both national and international levels will enable us to monitor and model biodiversity change in a timely, thorough, and meaningful way.
Our policy brief provides a global analysis of the status of 30 by 30 implementation, using data from our Biodiversity Intactness Index (BII).
We are also able to provide country-level data and analysis on request. If you would like to discuss specific country-level data, please get in touch via c.gold@nhm.ac.uk, cc biodiversityfuturesexplorer@nhm.ac.uk.
Below we provide examples of such country-level analysis for the United Kingdom, Colombia (the host of COP16 in October 2024), Azerbaijan (the host of COP29 in November 2024), and Brazil (the host of COP30 in November 2025).
Please note that the below resources and any further resources as requested are shared under a CC-BY-NC-SA license.
Areas delivering the most critical ecosystem services
Biodiversity intactness in 2000: 35.07%
Biodiversity intactness in 2020: 35.68%
Biodiversity intactness change: +0.61%
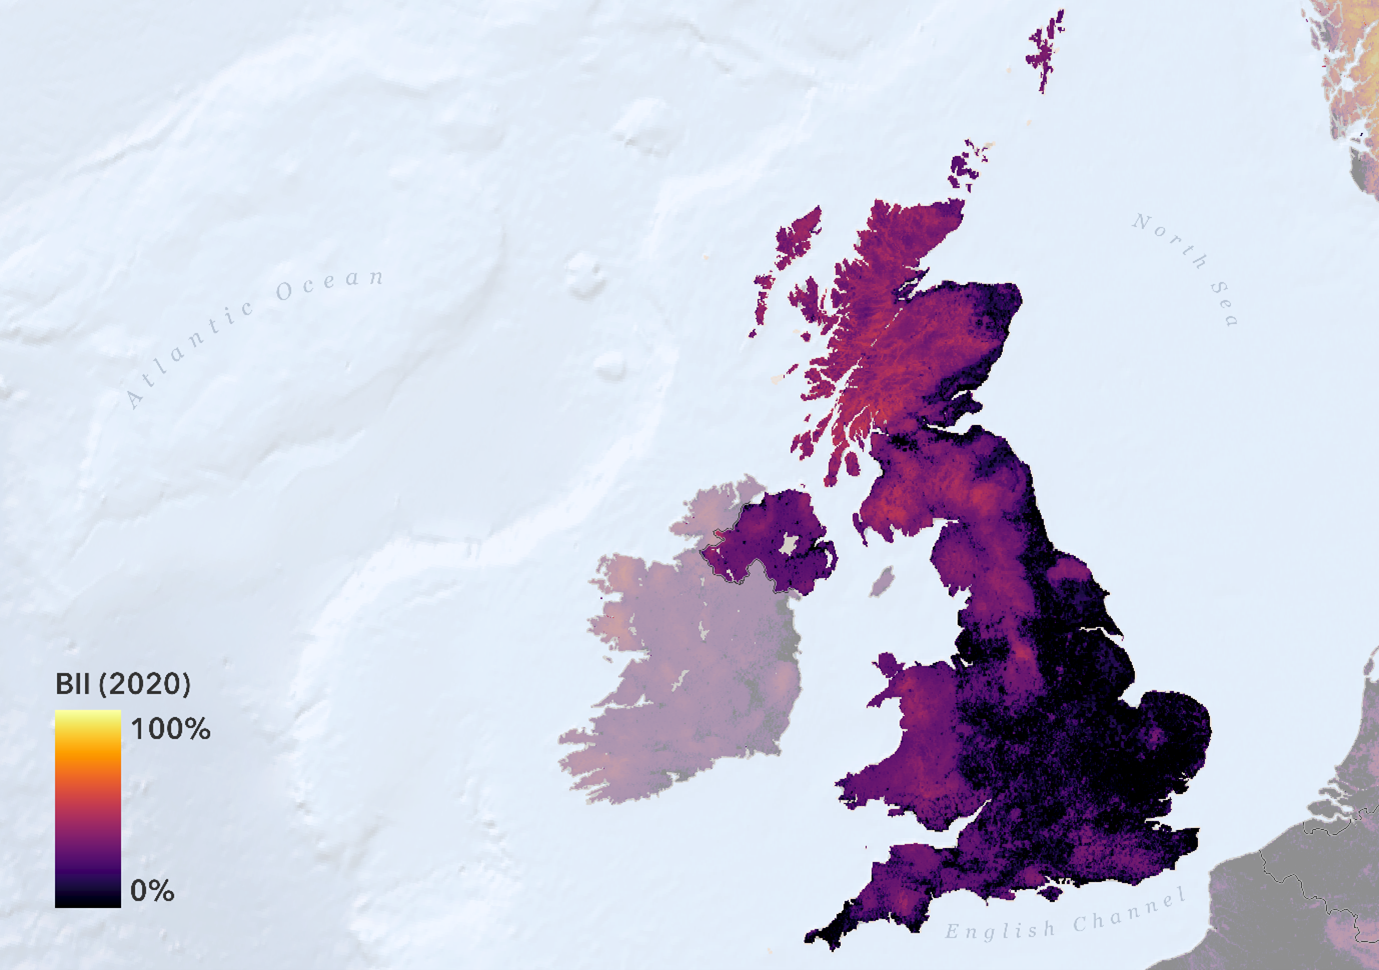
Overall biodiversity intactness in the UK in 2020.
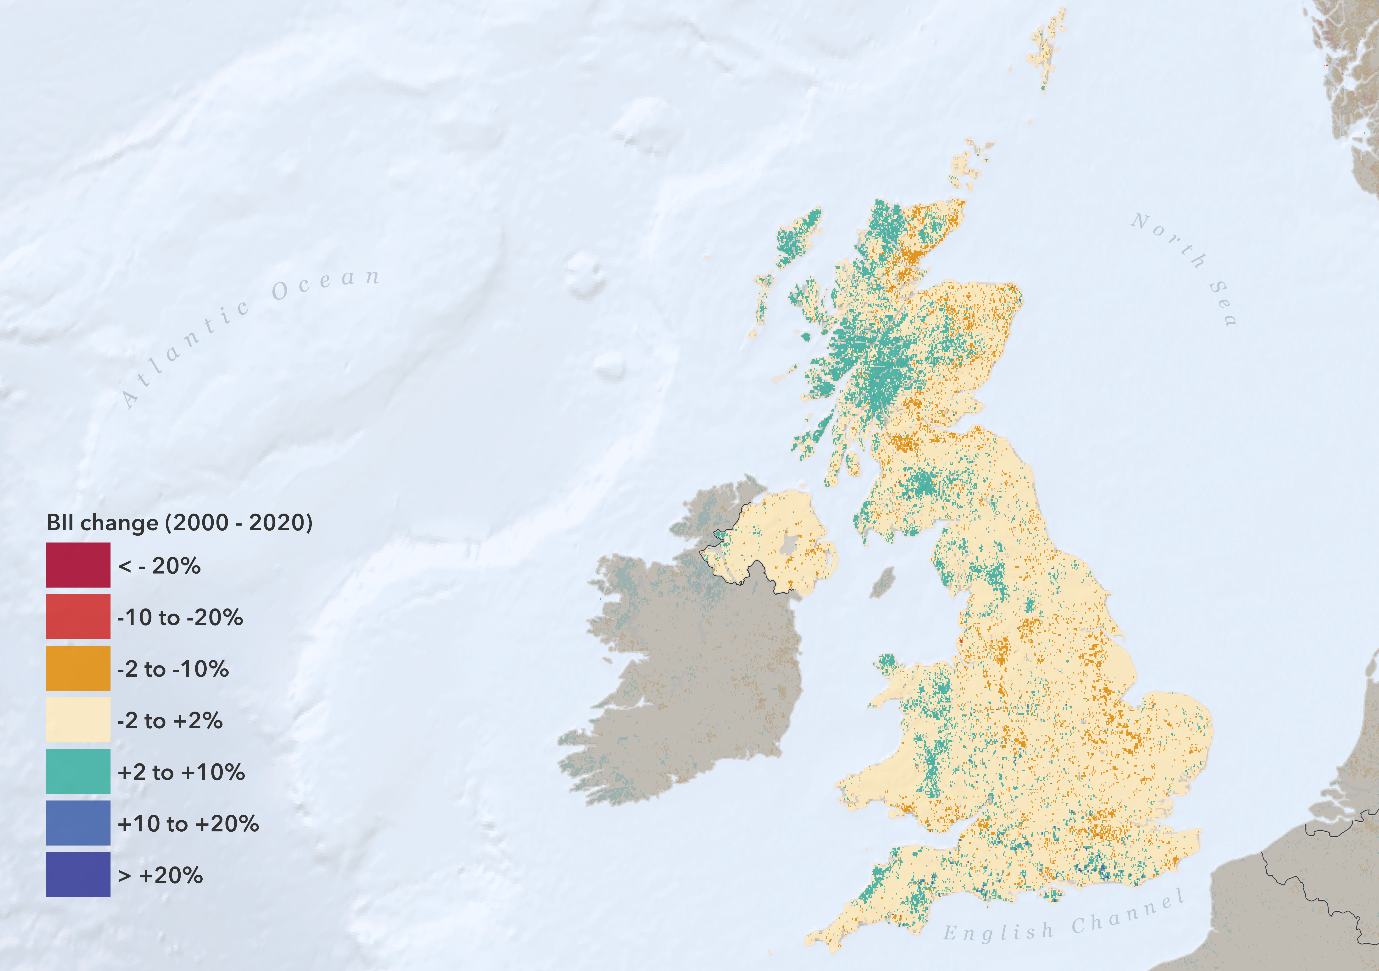
Change in biodiversity intactness in the UK between 2000 and 2020.
Locations of protected areas in the UK compared with the top 30% of land delivering the most critical ecosystem services.
Change in biodiversity intactness within the top 30% of UK land delivering the most critical ecosystem services between 2000 and 2020.
Colombia - Host of COP16
Country overall
Biodiversity intactness in 2000: 75.74%
Biodiversity intactness in 2020: 74.22%
Biodiversity intactness change: -1.51%
Areas delivering the most critical ecosystem services
Biodiversity intactness in 2000: 69.83%
Biodiversity intactness in 2020: 67.75%
Biodiversity intactness change: -2.08%
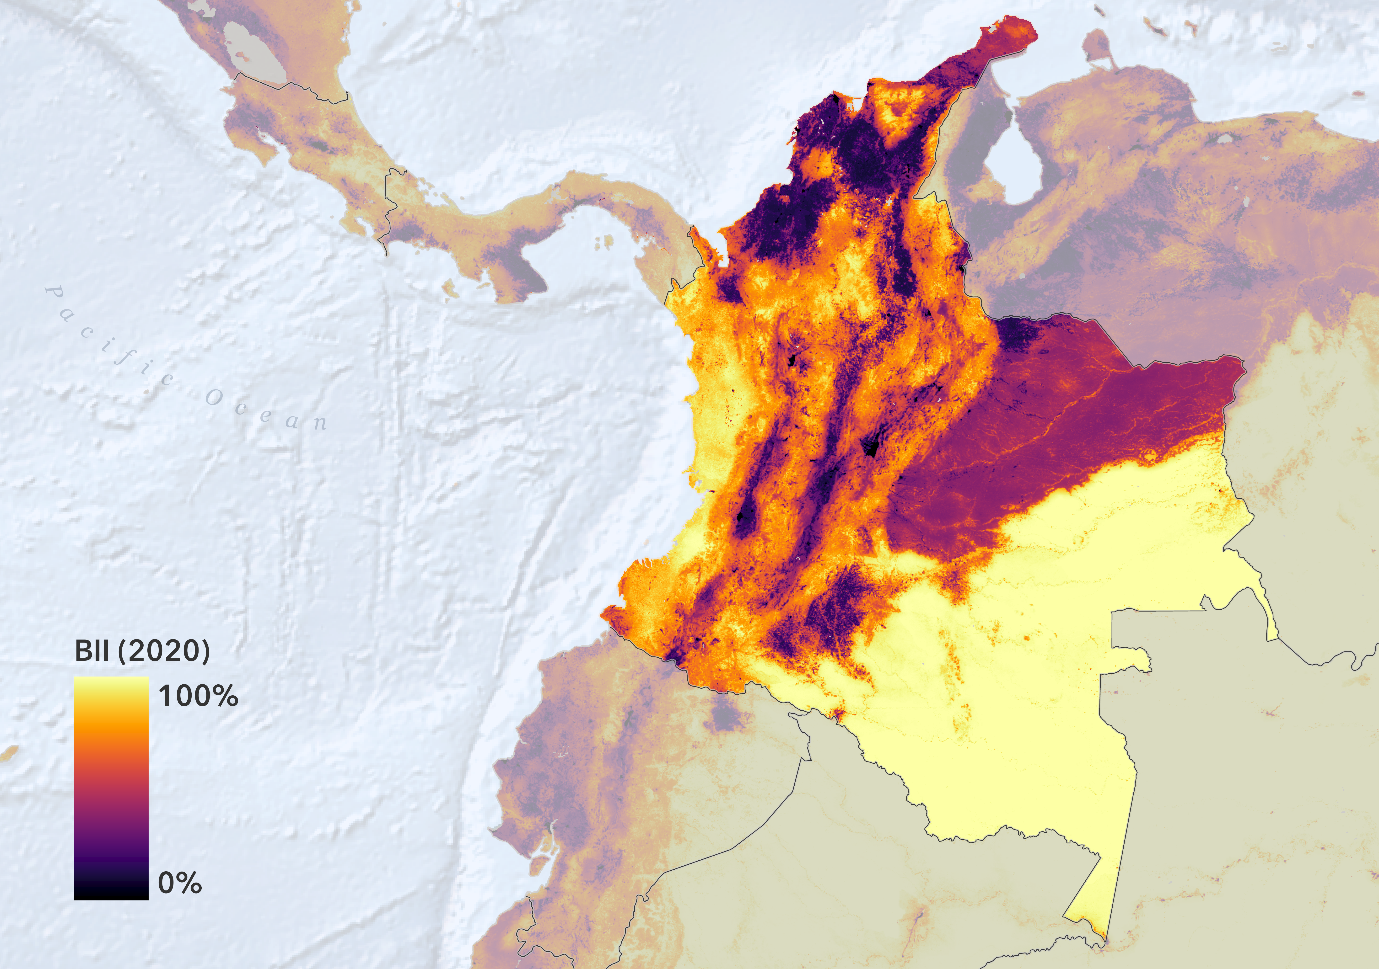
Overall biodiversity intactness in Colombia in 2020.
Change in biodiversity intactness in Colombia between 2000 and 2020.
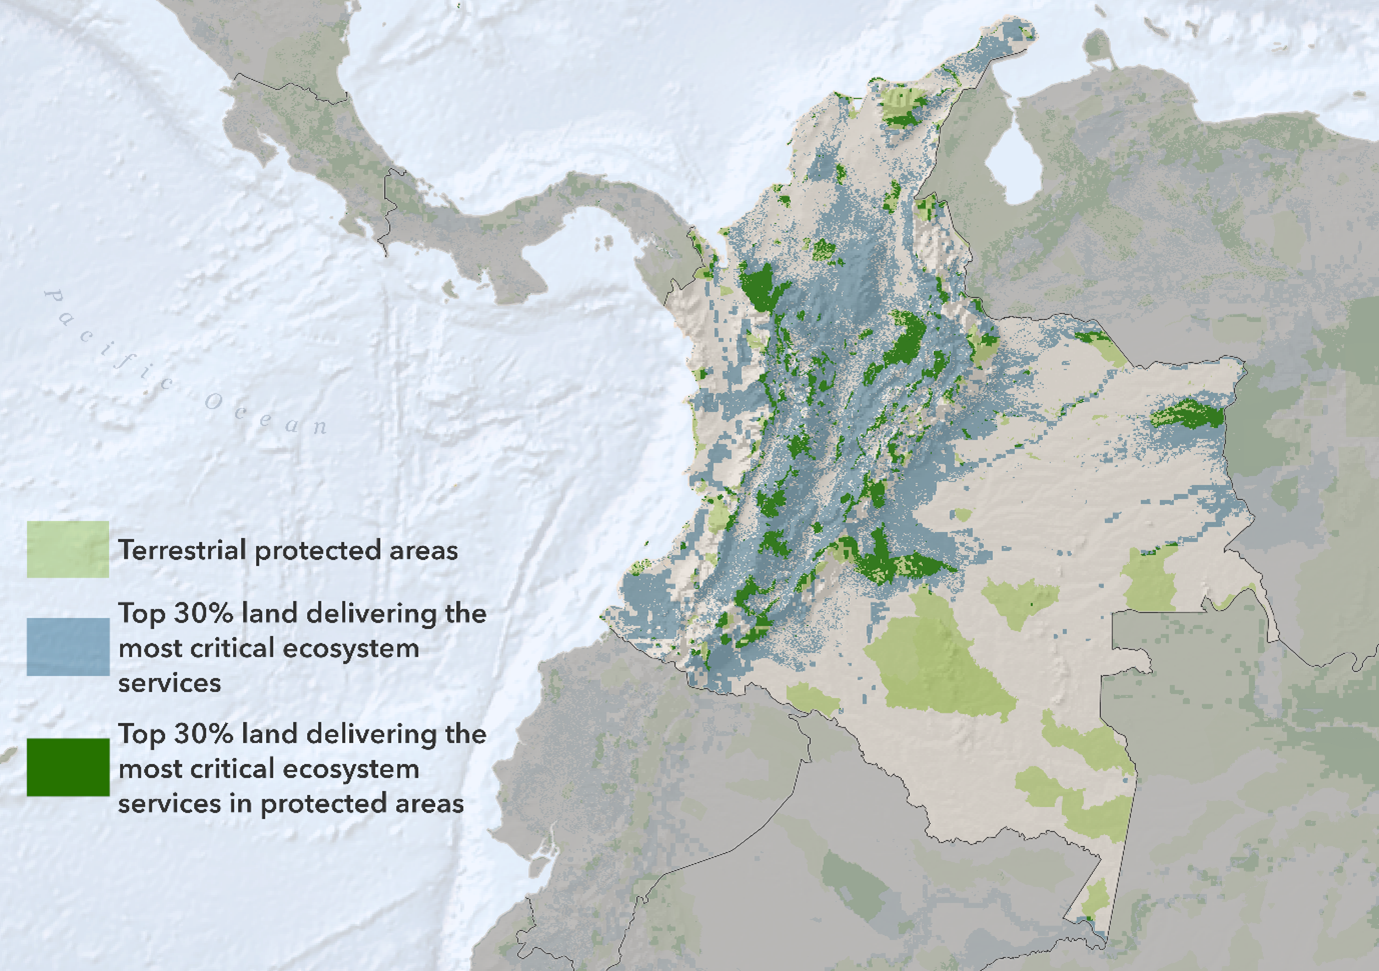
Locations of protected areas in the Colombia compared with the top 30% of land delivering the most critical ecosystem services.
Change in biodiversity intactness within the top 30% of land in Colombia delivering the most critical ecosystem services between 2000 and 2020.
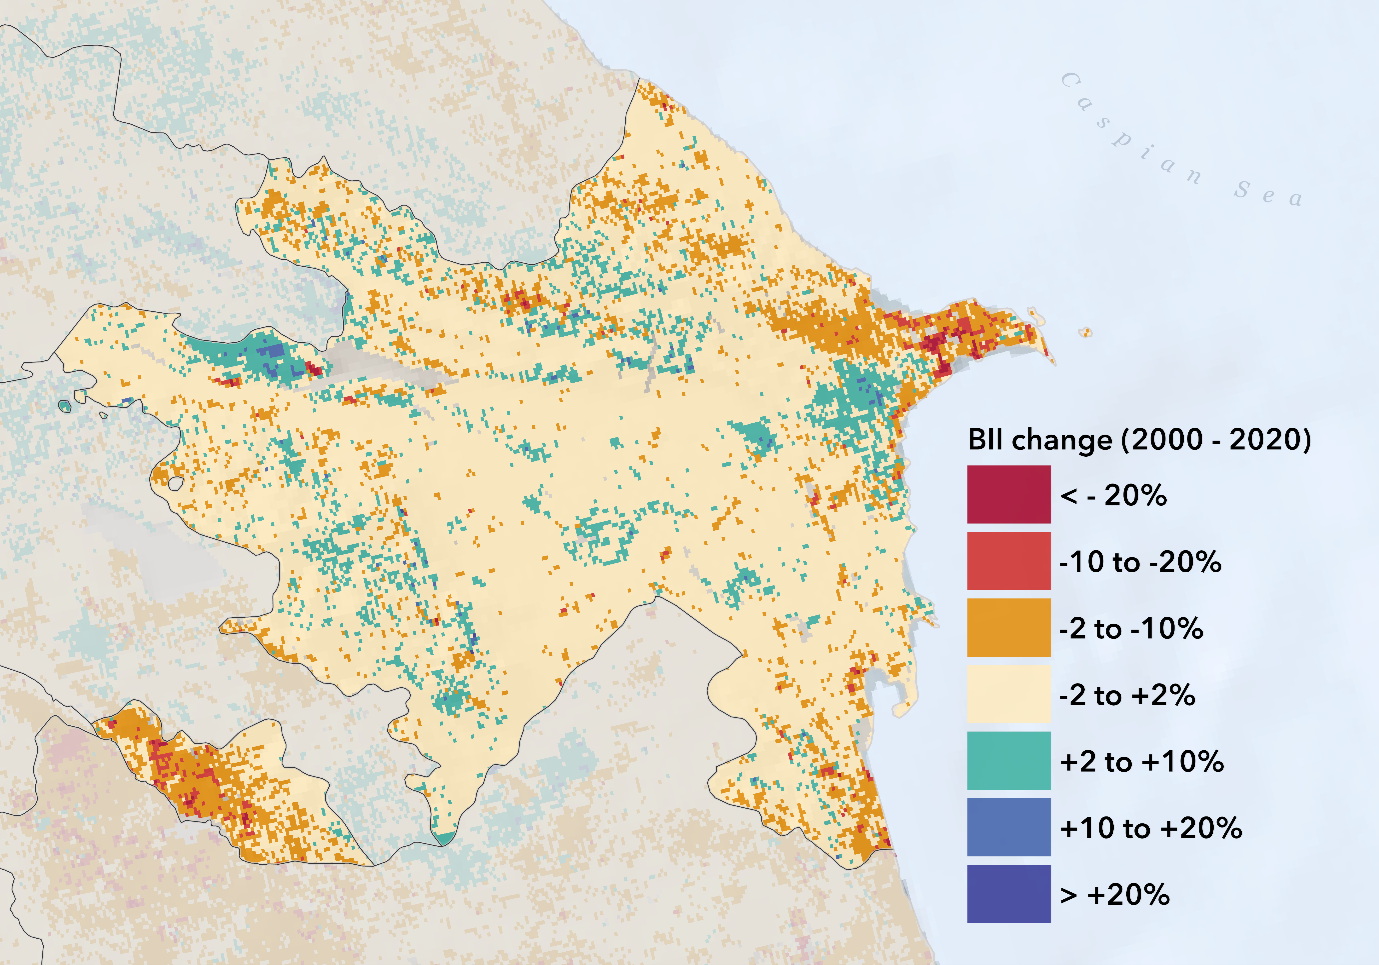
Azerbaijan - Host of COP29
Country overall
Biodiversity intactness in 2000: 36.89%
Biodiversity intactness in 2020: 36.56%
Biodiversity intactness change: -0.32%
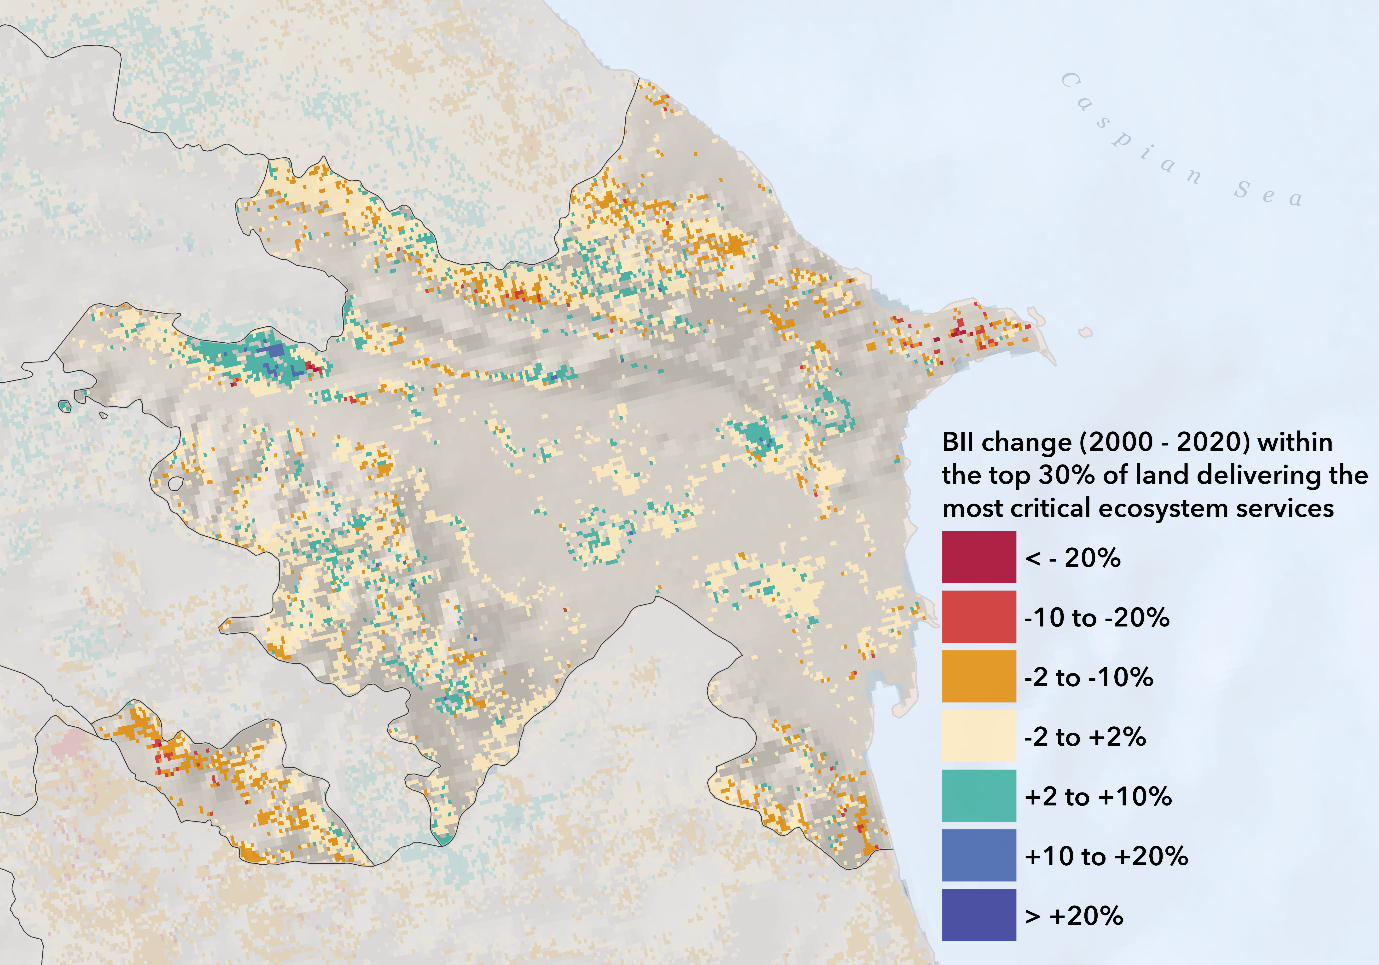
Areas delivering the most critical ecosystem services
Biodiversity intactness in 2000: 49.28%
Biodiversity intactness in 2020: 49.11%
Biodiversity intactness change: -0.17%
Overall biodiversity intactness in Azerbaijan in 2020.
Change in biodiversity intactness in Azerbaijan between 2000 and 2020.
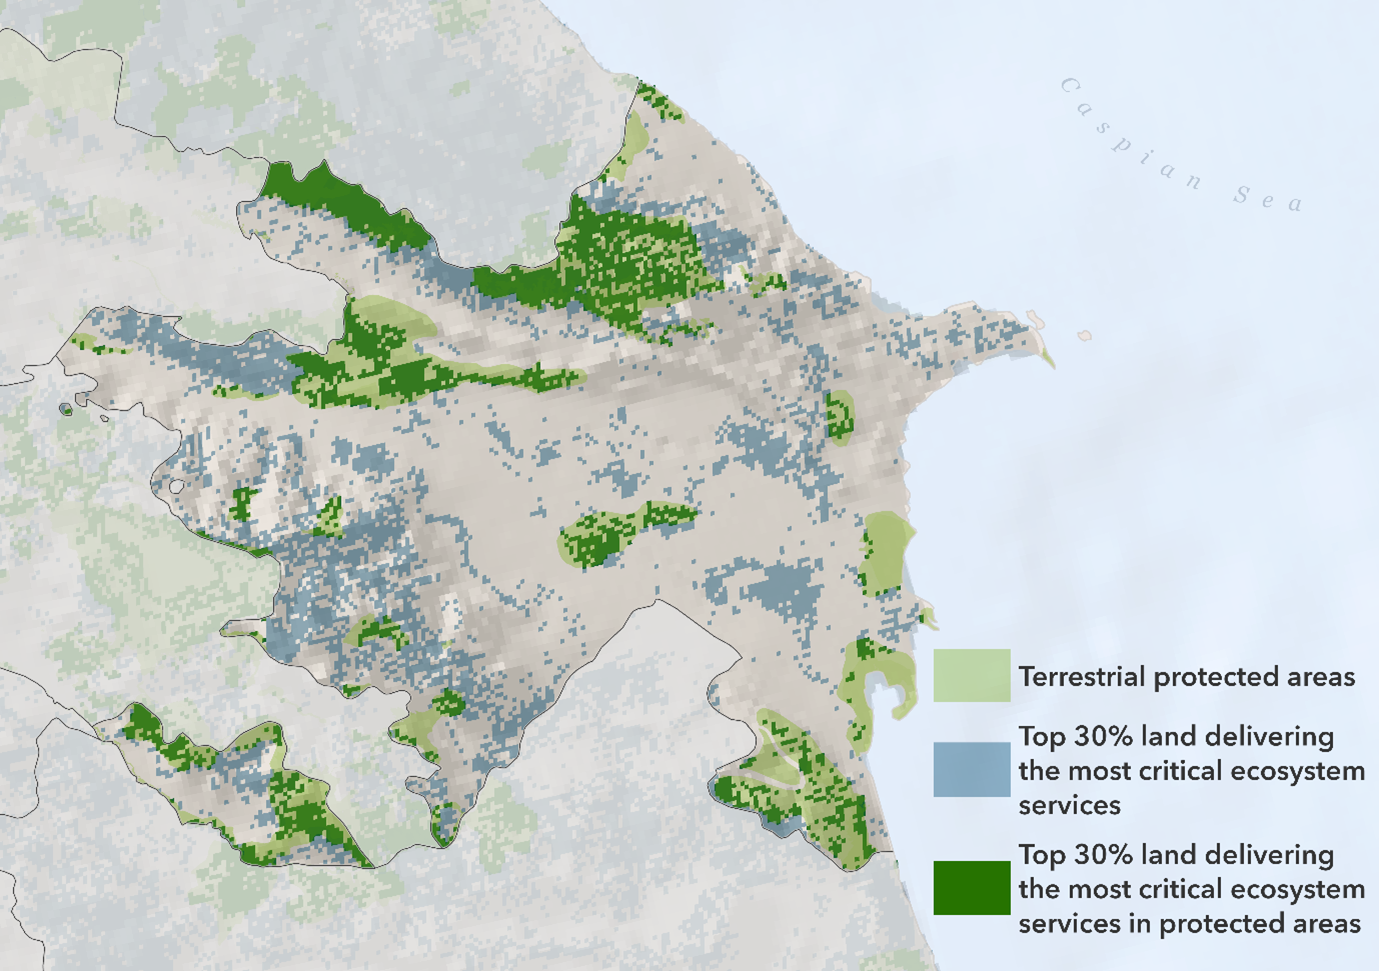
Locations of protected areas in Azerbaijan compared with the top 30% of land delivering the most critical ecosystem services.
Change in biodiversity intactness within the top 30% of land in Azerbaijan delivering the most critical ecosystem services between 2000 and 2020.
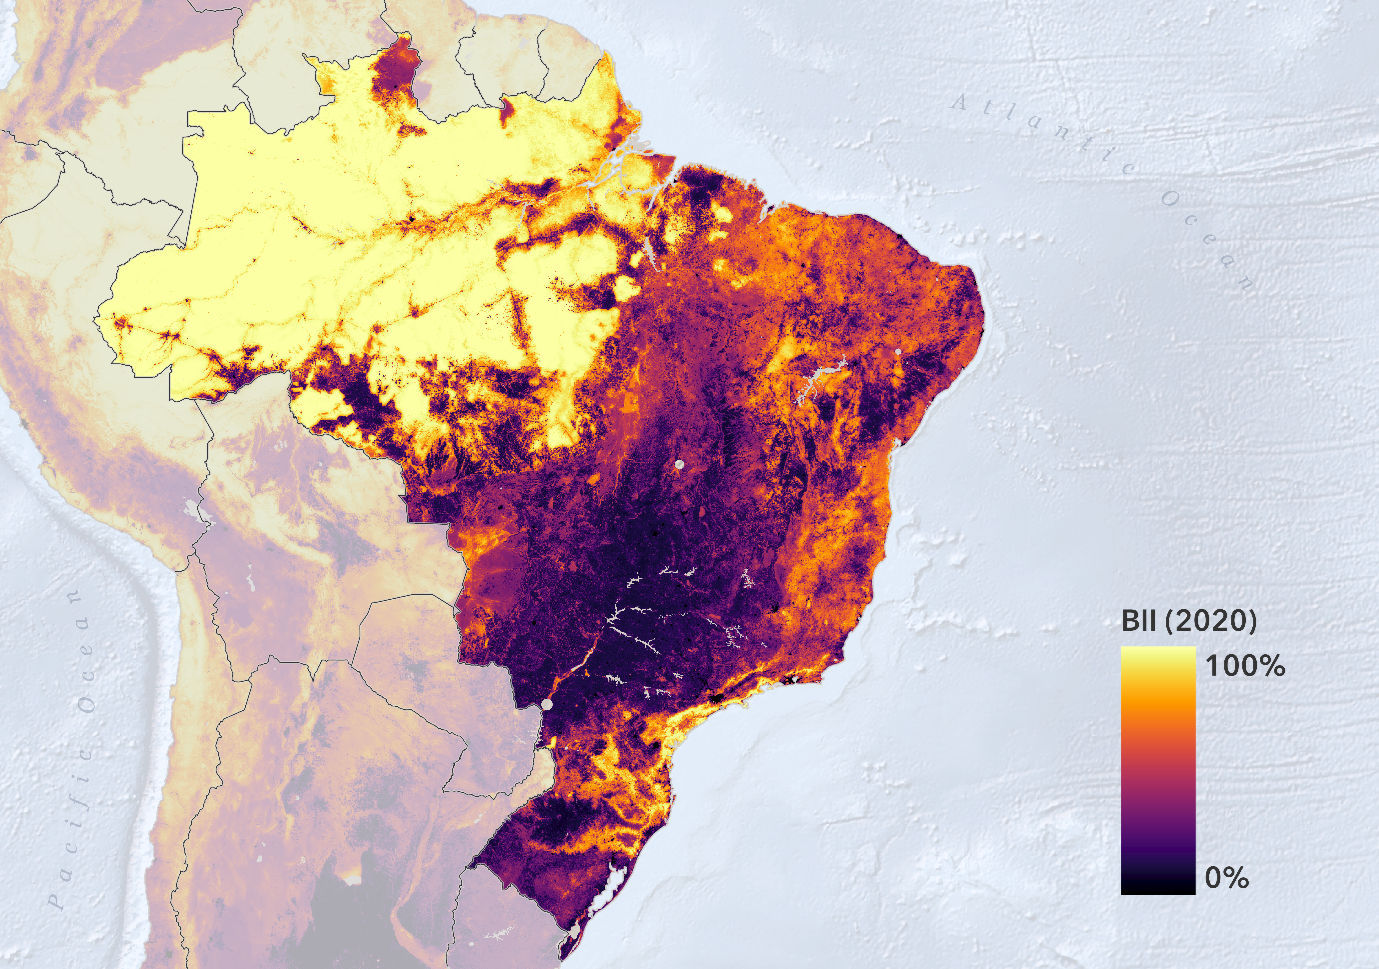
Brazil - Host of COP30
Country overall
Biodiversity intactness in 2000: 67.70%
Biodiversity intactness in 2020: 65.48%
Biodiversity intactness change: -2.22%
Areas delivering the most critical ecosystem services
Biodiversity intactness in 2000: 64.81%
Biodiversity intactness in 2020: 63.12%
Biodiversity intactness change: -1.69%
Overall biodiversity intactness in Brazil in 2020.
Change in biodiversity intactness in Brazil between 2000 and 2020.
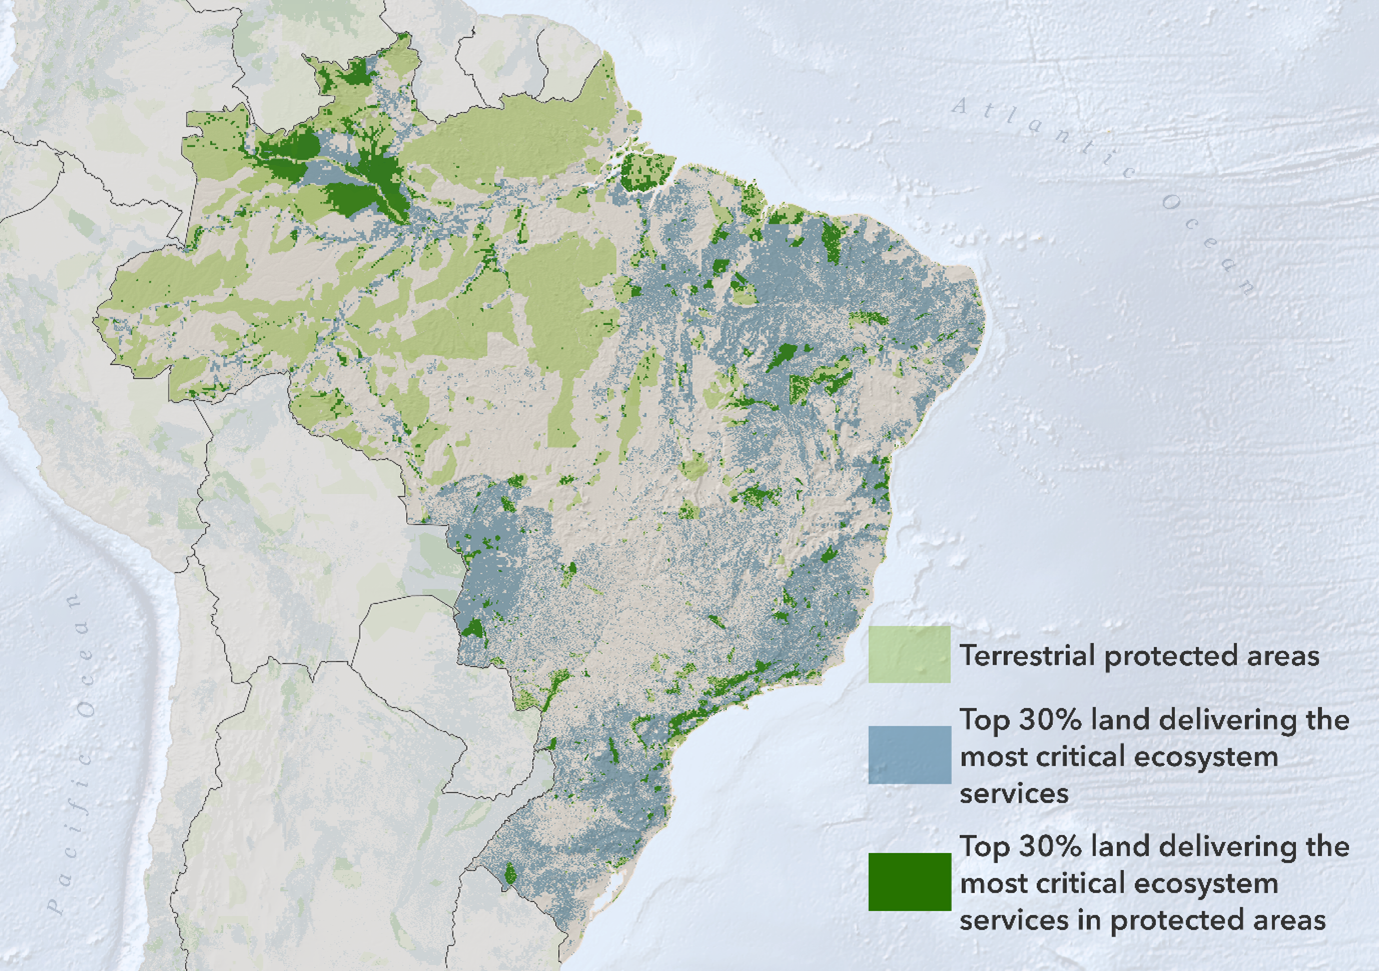
Locations of protected areas in Brazil compared with the top 30% of land delivering the most critical ecosystem services.
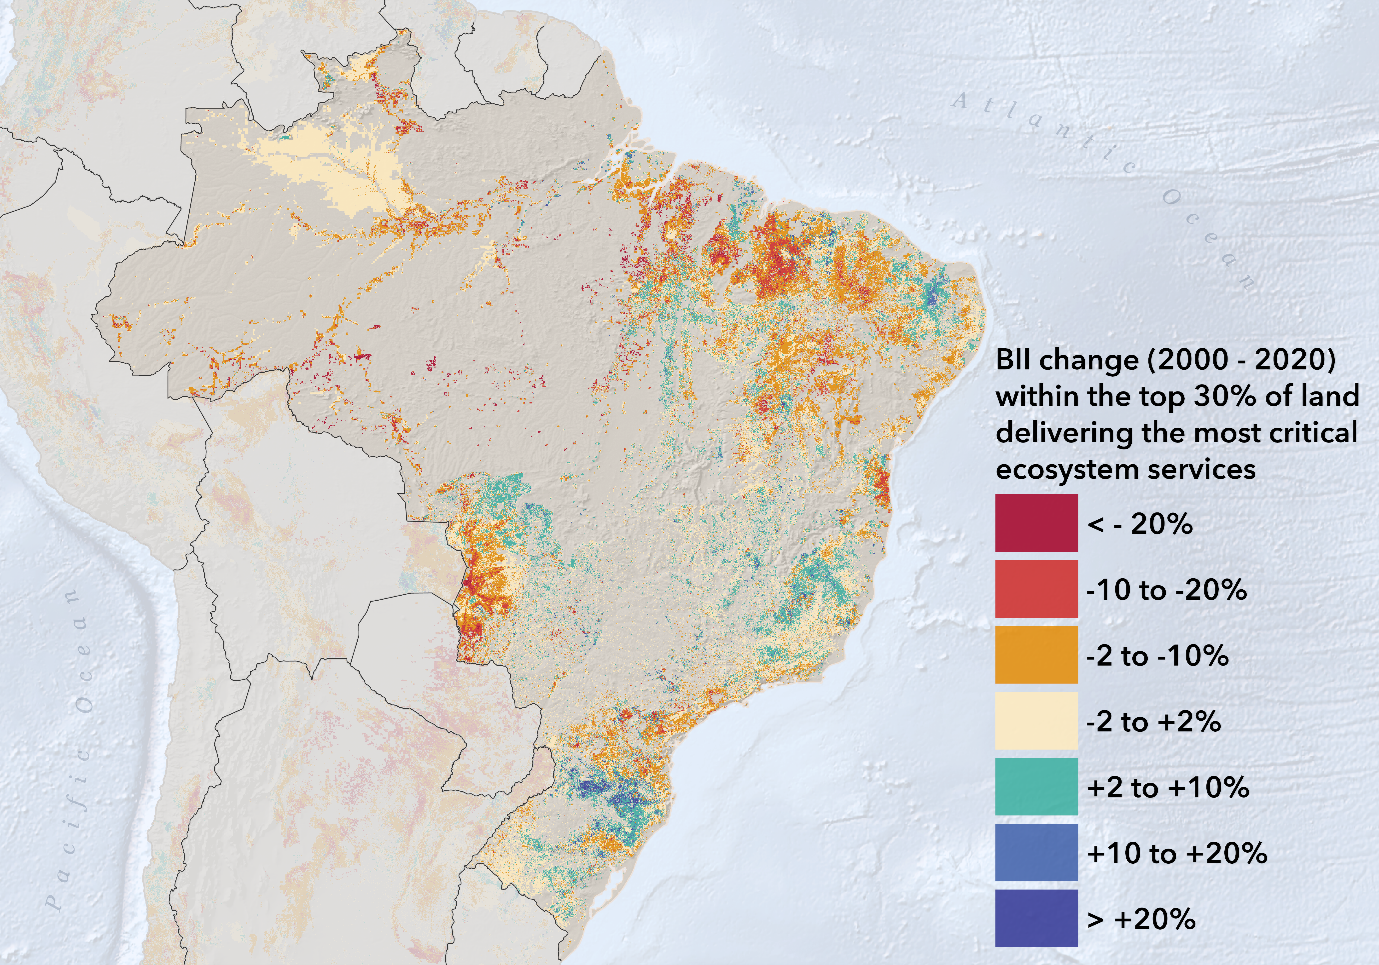
Change in biodiversity intactness within the top 30% of land in Brazil delivering the most critical ecosystem services between 2000 and 2020.
Accept cookies?
We use cookies to give you the best online experience. We use them to improve our website and content, and to tailor our digital advertising on third-party platforms. You can change your preferences at any time.